
Part 1 describes how to setup the hardware, part 2 describes how to to record/persist the sensor information.
In this post I’ll describe how to display the data.
TL;DR
- Download and unzip the source code from https://github.com/draptik/rpi-temperature-website/archive/v1.0.zip
npm installbower install- (for deployment in LAN: Configure
baseUrlinapp.js) - (for deployment in LAN: Configure
dbLocationinapp_api/models/db.js) - (for deployment in LAN:
export SET_ENV=production) npm start
Should be similar to http://rpi-temperatures-website-demo.firebaseapp.com/.
Choosing the right technology stack
This really depends on your individual needs. Here are some points to consider:
- How many people will be accessing the site?
- Do you have to access the site from outside of your LAN? Do you need a login mechanism?
- Which technology stack are you comfortable with? Which technology stack is supported on the server?
- Database interaction possible (this demo uses SQLite3)?
If you know that you’ll have many requests I would discourage you from using the Raspberry Pi (RPi) as a web server.
Otherwhise, the RPi is a good choice for a web server.
Some of the technology stacks available on the RPi are:
- JVM: Java, Scala
- .NET/Mono: C#, F#
- Python
- JS: Node.js
Since I only want to display data in my LAN I decided to use Javascript: Node.js in combination with the Express framework provides all possible features and is very lightweight.
No matter which stack you choose: Running the web site on the same RPi as the temperature recording from the previous posts saves you the hassle of installing software on a different machine. And it obviously saves energy, since the RPi is running 24/7 anyway recording temperature data.
User Interface
My primary goal was explorative data visualization. For this purpose I decided to show 2 plots:
- an overview plot showing the past 14 days
- and a detail plot, showing the selection of the overview plot
You can test the website with some sample data at http://rpi-temperatures-website-demo.firebaseapp.com/
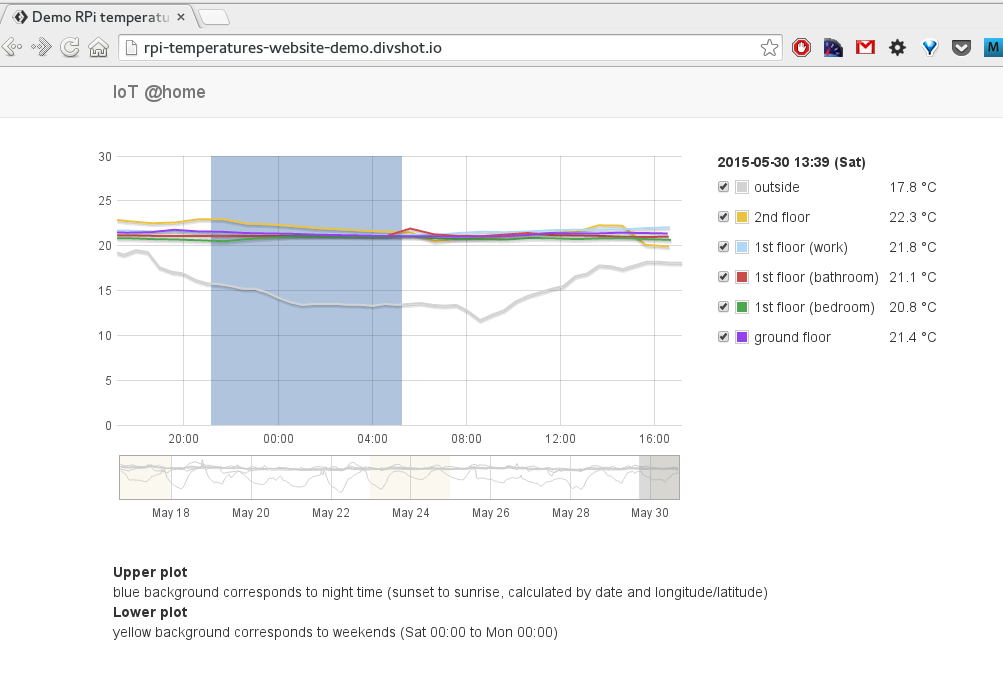
Some of the UI features:
- The detail plot can be dragged and the overview plot has a selection region which can be resized and dragged.
- Changes to either plot are reflected in the other.
- Mouse movement in the detail plot updates the legend.
All charting features are implemented using Flot.
Prerequisites: Node.js
Here is a very concise manual on how to install Node.js on the RPi (this gives you a more up to date version of Node.js than default Raspbian does): http://weworkweplay.com/play/raspberry-pi-nodejs/
Installation
All further instructions are expected to be executed on the RPi.
Download and unzip the source code from
https://github.com/draptik/rpi-temperature-website/archive/v1.0.zip
cd ~
mkdir website && cd website
wget https://github.com/draptik/rpi-temperature-website/archive/v1.0.zip
unzip *.zip
cd rpi*
Install backend packages (node packages are defined in packages.json):
npm install
Node.js packages are installed to folder node_modules.
- the folder
app_servercontains the basic web site. - the folder
app_apiprovides the REST backend.
Install frontend packages (bower packages are defined in bower.json):
bower install
Bower packages are installed to folder public/vendor/bower.
You should now be able to start the application (using the provided sample data in folder sample_data):
npm start
Configuration (development vs production)
The application uses a single switch between development mode and production mode:
NODE_ENV
This information is currently used in the following places in the application:
REST URL
Setting the URL for the REST service (in app.js):
var url = process.env.NODE_ENV === 'production' ? 'http://camel:3000' : 'http://localhost:3000';
Within my LAN the RPi is named camel…
And in case you’re not familiar with the syntax
var result = someCondition ? 'string1' : 'string2';
It’s just a shorthand for
var result;
if (someCondition) {
  result = 'string1';
} else {
  result = 'string2';
}
Database location
Setting the database location (in app_api/models/db.js):
var dbLocation = process.env.NODE_ENV === 'production' ? '/var/www/templog.db' : 'sample_data/templog.db';
Usage
Once you’ve configured the LAN URL and the database location, you can set the environment variable NODE_ENV to production and start the application:
export NODE_ENV=production
npm start
Customizing
You will probably want to customize the UI, as my design skills are limited at best. ;-)
Here’s an overview of the project, so you know where to change things:
├── app_api                     //  REST API
│   ├── controllers
│   │   └── temperatures.js
│   ├── models
│   │   ├── db.js               //  DATABASE
│   └── routes
│       └── index.js
├── app.js                      //  MAIN ENTRY POINT FOR THE APPLICATION
├── app_server                  //  web server (express.js)
│   ├── controllers
│   │   ├── main.js
│   │   └── temperatures.js
│   ├── models
│   ├── routes
│   │   ├── index.js
│   │   ├── temperatures.js
│   └── views
│       ├── error.jade
│       ├── index.jade
│       ├── layout.jade
│       └── temperatures-list.jade
├── bower.json                  //  Bower configuration (frontend)
├── node_modules                //  Location of node modules
├── nodemon.json                //  nodemon configuration
├── package.json                //  node configuration
├── public                      //  frontend stuff...
│   ├── images                  //  images
│   ├── scripts                 //  Javascript code
│   │   ├── chart.js            //  This file includes all charting code
│   │   ├── rest.js             //  wrapper code to access REST API
│   │   └── suncalc.js          //  calc sunrise/sunset on the fly
│   ├── stylesheets             //  ...
│   │   ├── app.css
│   │   ├── chart.css
│   └── vendor                  //  3rd party libraries
│       ├── bower               //  ...installed via bower
│       └── custom              //  ...other 3rd party libraries
├── sample_data                 //  sample data
│   └── templog.db              //  sqlite3 sample data set
That’s it. Have fun!